

Heatwaves aren’t just unpleasant, they also result in additional deaths. This article looks at how excess mortality is measured in the UK, who is impacted, and what the long-term trend looks like.
How many excess deaths does heat cause in England?
The UK Health Security Agency (UKHSA) reports 1,504 heat-associated deaths for 2025. 2026 started hotter, with 2,877 deaths reported as an interim estimate by June.
For context:
534,020 total deaths were recorded in England in 2025
~3,000 cold-related deaths were reported for the winter of 2024/25 (or around half after adjusting for flu)
Only giving rough numbers here for context, because UKHSA initially reported incorrect figures
Overall excess winter deaths are about 10x higher
It’s hard to measure heat-related deaths
Heat is not generally recorded as the cause of death. Instead, heatwaves increase deaths for people with existing health conditions.
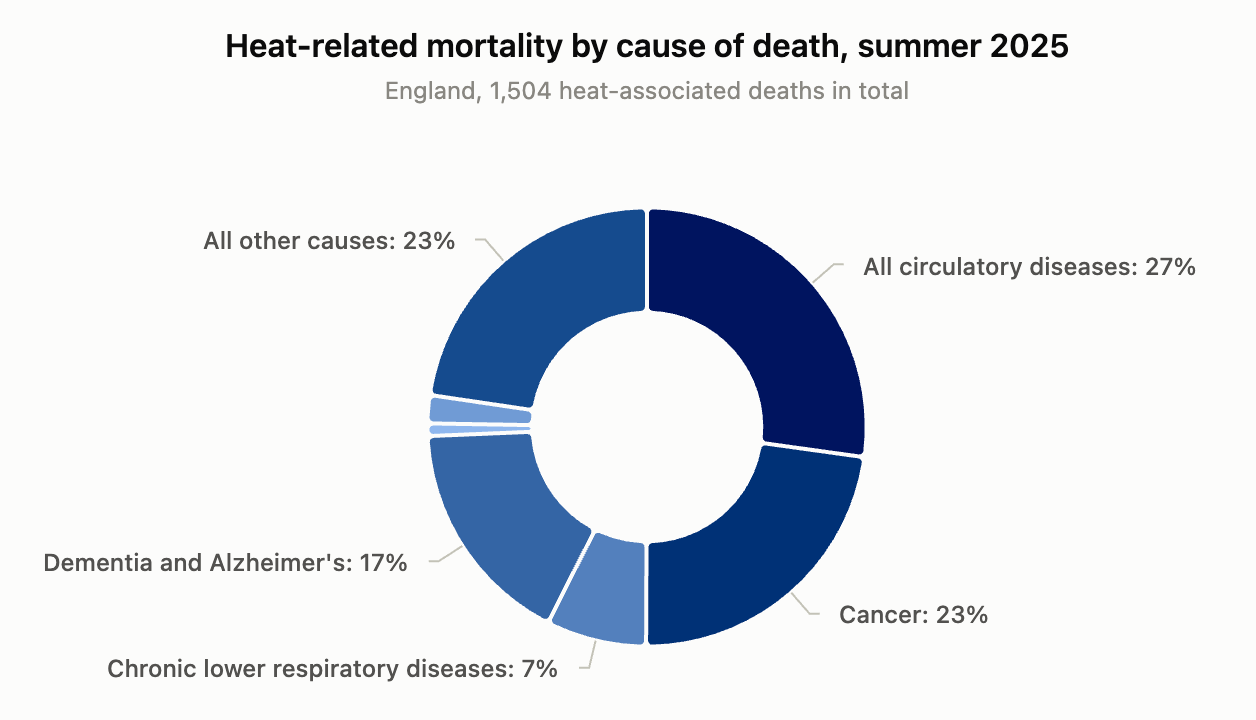
So the heat-related mortality figures are not a count, but rather a statistical estimate of excess deaths during hot days.
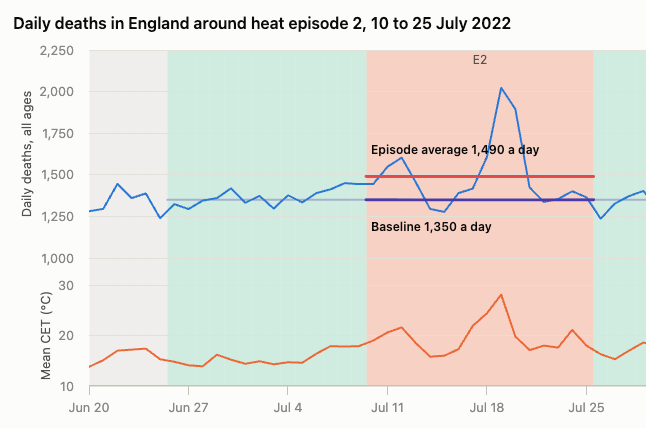
The UKHSA chart below shows how daily deaths are slightly above baseline during hot periods.
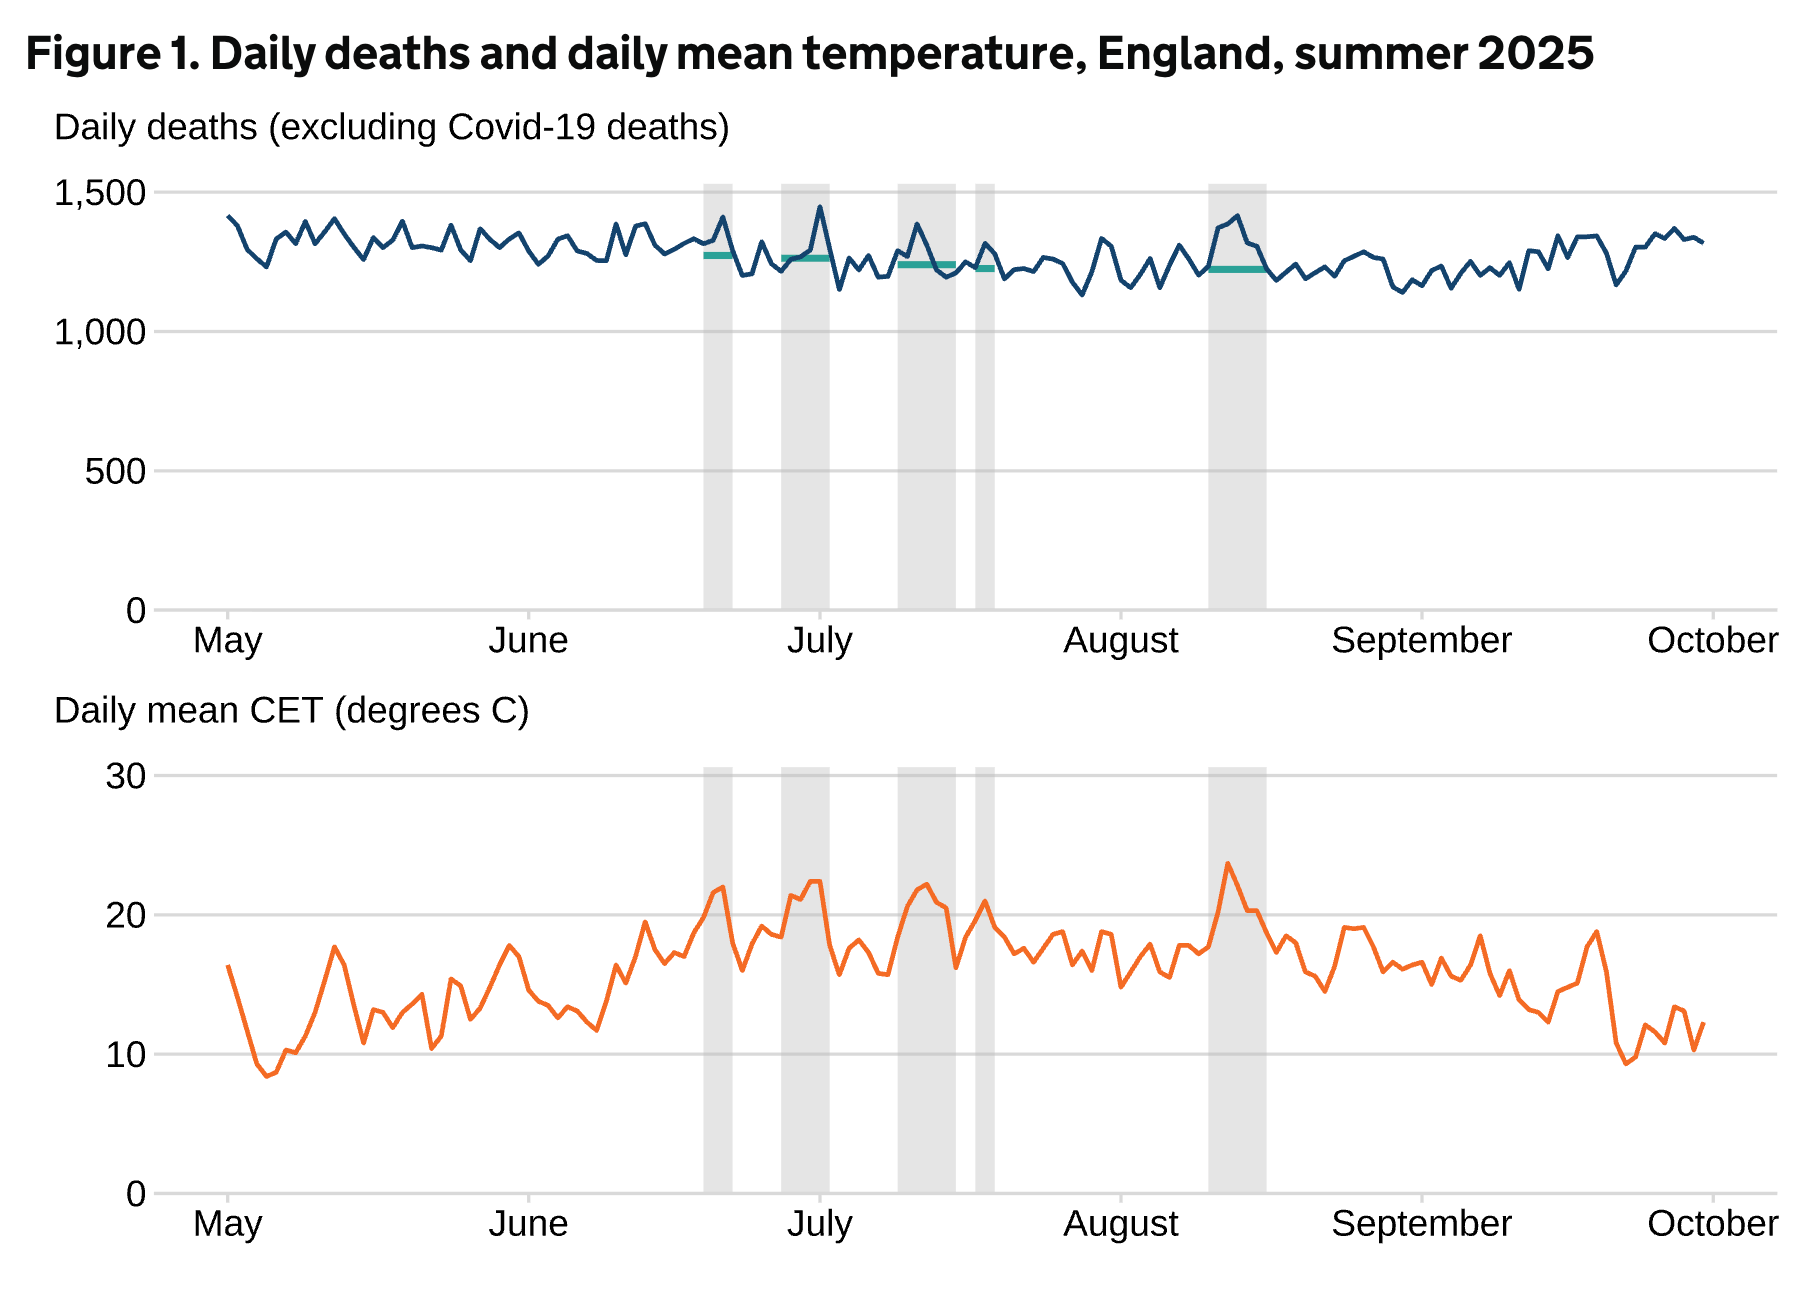
The pattern isn’t super obvious, which is also reflected in the broad confidence interval reported by UKHSA. Based on their method, they report a 95% confidence interval for the number of heat-associated death between 936 and 2,072.
What is a heat episode?
UKHSA uses an England-wide definition for heat episodes:
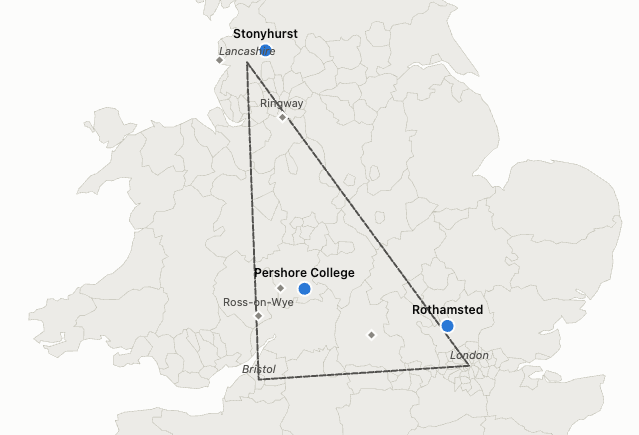
Heat episodes are defined as days on which the mean Central England Temperature (CET) is at least 20°C. One day either side is also included; an extra day can also be included if merited by a sudden change in temperature.
Central England Temperature records the average of three locations around England.
How are excess deaths during a heat episode calculated?
UKHSA calculates the average number of deaths for a baseline period 14 days before and after the heat episodes (skipping any days that belong to a different heat episode). This average is then compared to the average during the heat episode.
I had Claude reconstruct this for a heat episode in 2022. It reported 179 excess deaths compared to 187 reported by UKHSA. This is likely because UKHSA excludes COVID deaths from its data.
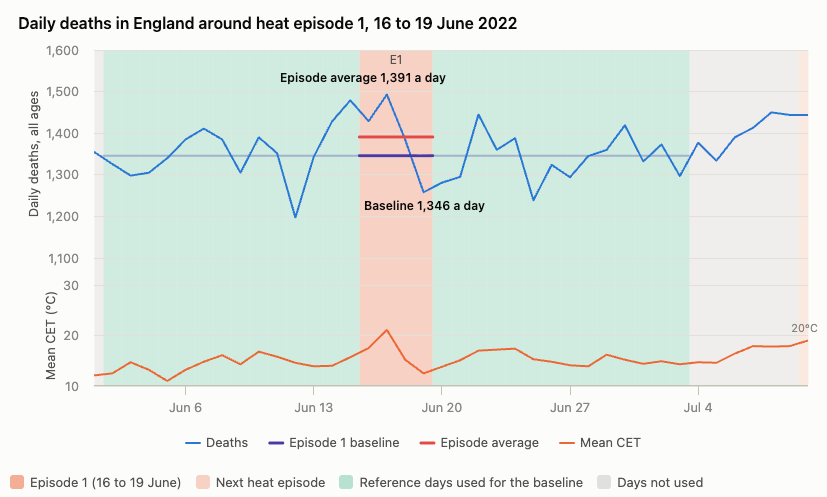
Note that this is an early episode that doesn’t show very clearly in the chart. This is shown by the -27 to 401 deaths confidence interval.
The second heat episode that year shows a clearer pattern of rising deaths. (Although the rebuild overstates it compared to UKHSA figures, likely due to high COVID deaths at the same time.)
Who dies from heat waves?
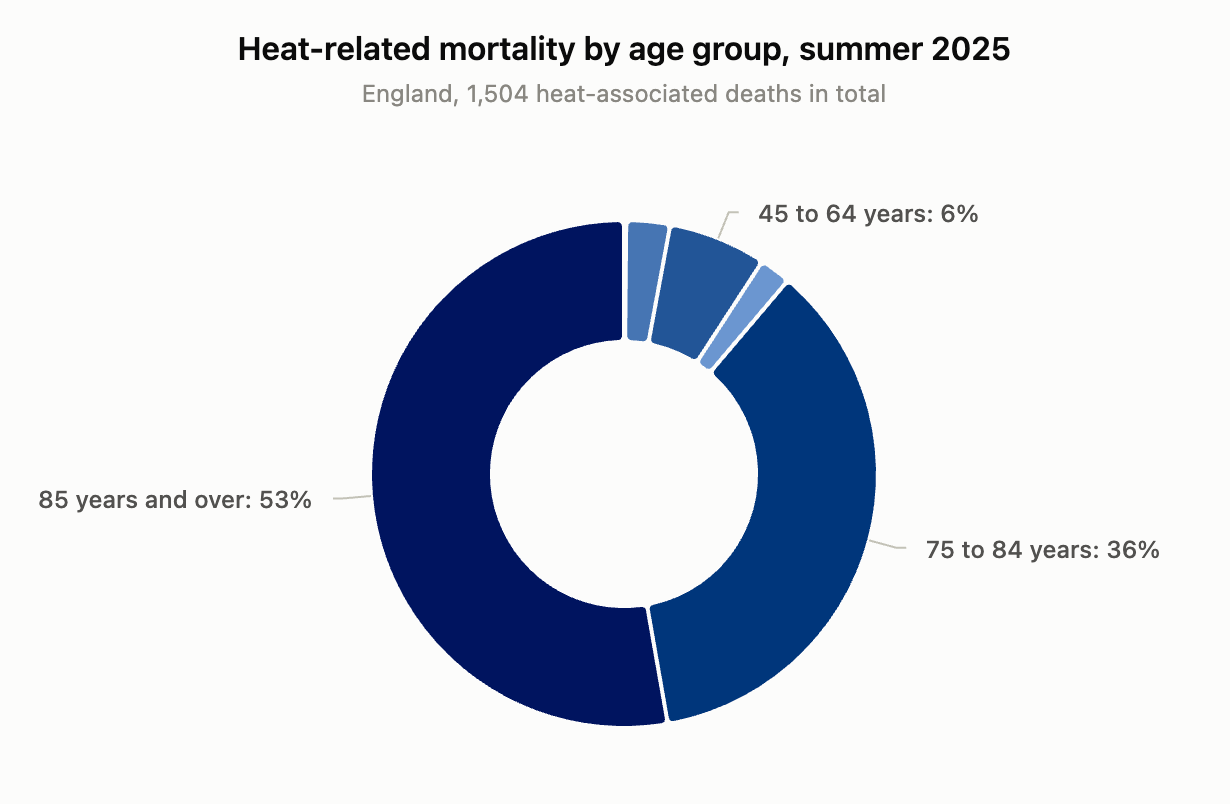
Mostly old people. Over half of additional deaths in 2025 are from people 85 or older. 89% were at least 75 years old.
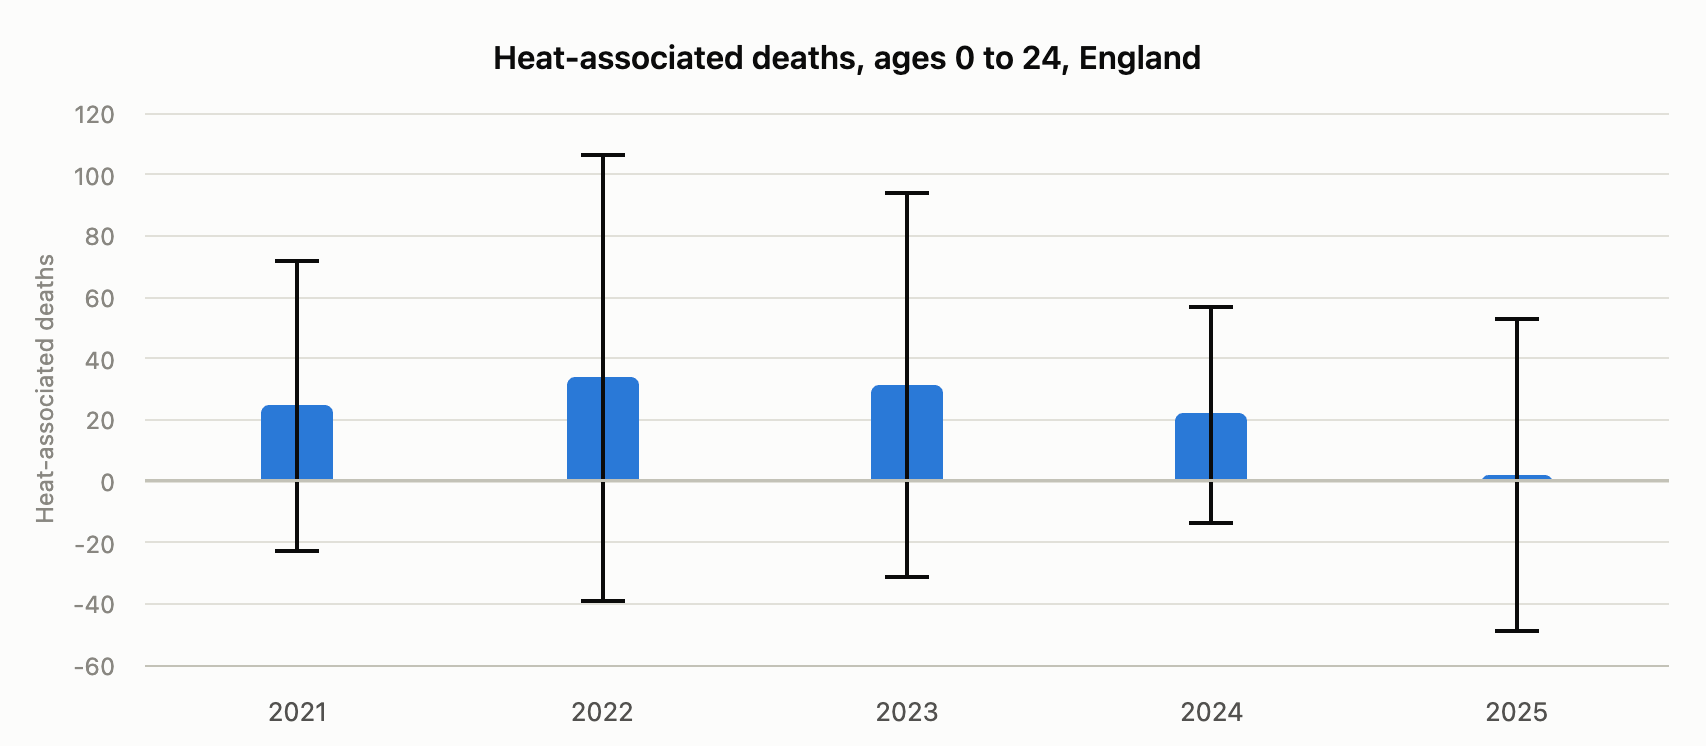
Young children are often reported as being especially at risk from overheating. However, the 2021 to 2025 UKHSA monitoring data only shows about an average of 23 heat-associated deaths for the entire age range from 0 to 24. I think one factor contributing to that figure could also be a higher number of drownings during heat episode days.
Are heat-related deaths increasing?
That would make sense:
The UK is getting hotter
There are more older people who are impacted
Better healthcare and heat adaptation are unlikely to have fully counteracted those factors. (I think?)
Here’s a simple chart showing the increase, based on data from the Office for National Statistics (ONS).
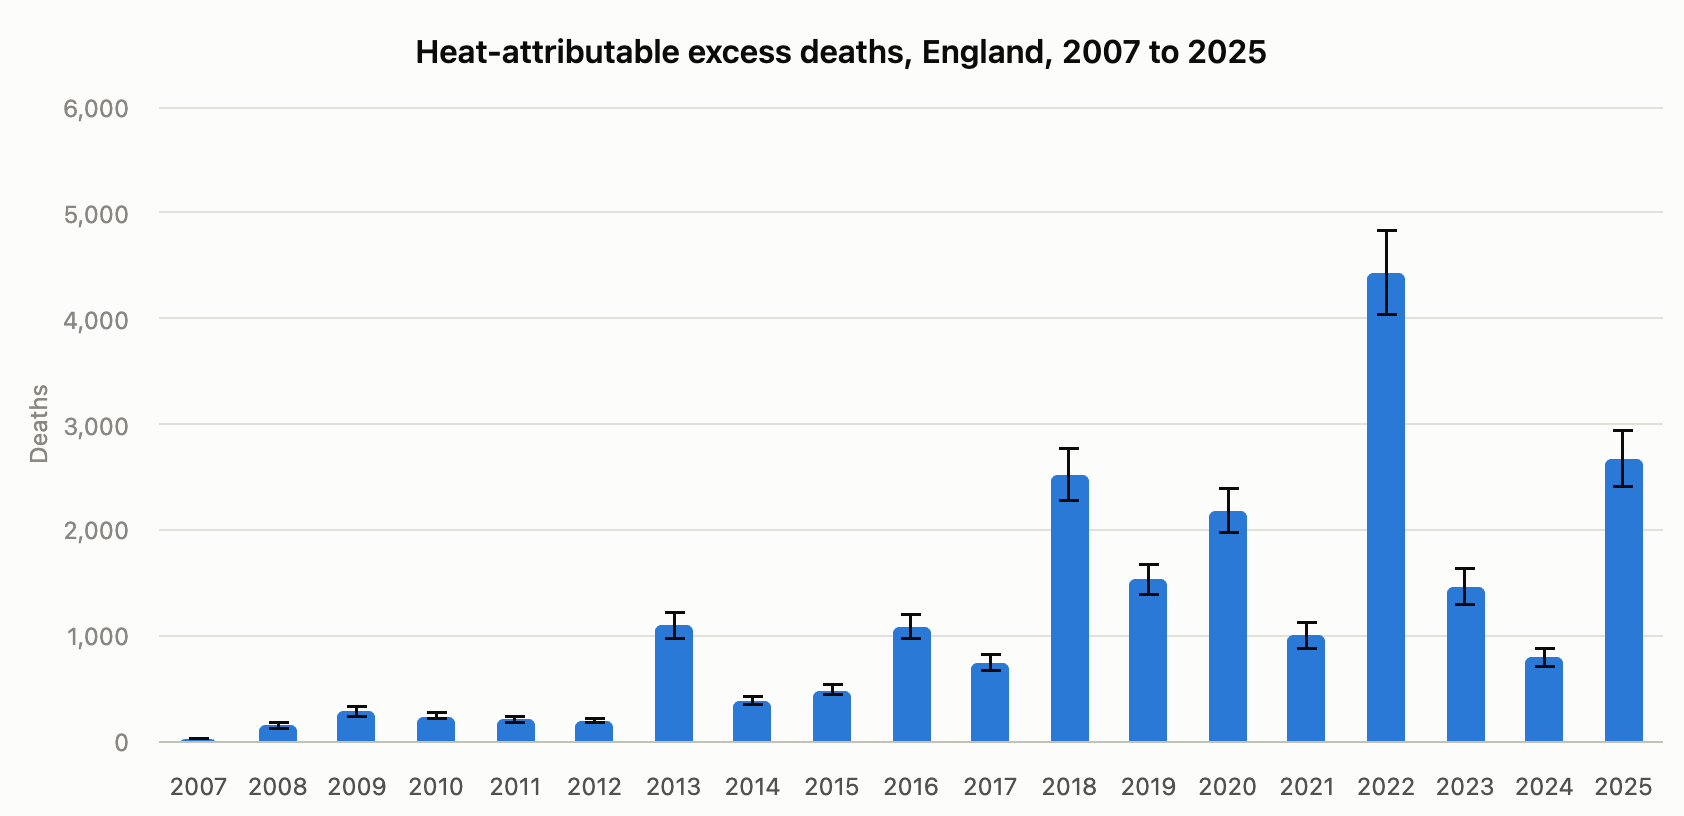
This shows a nice pattern. Then you zoom out and the data starts looking slightly less clear.
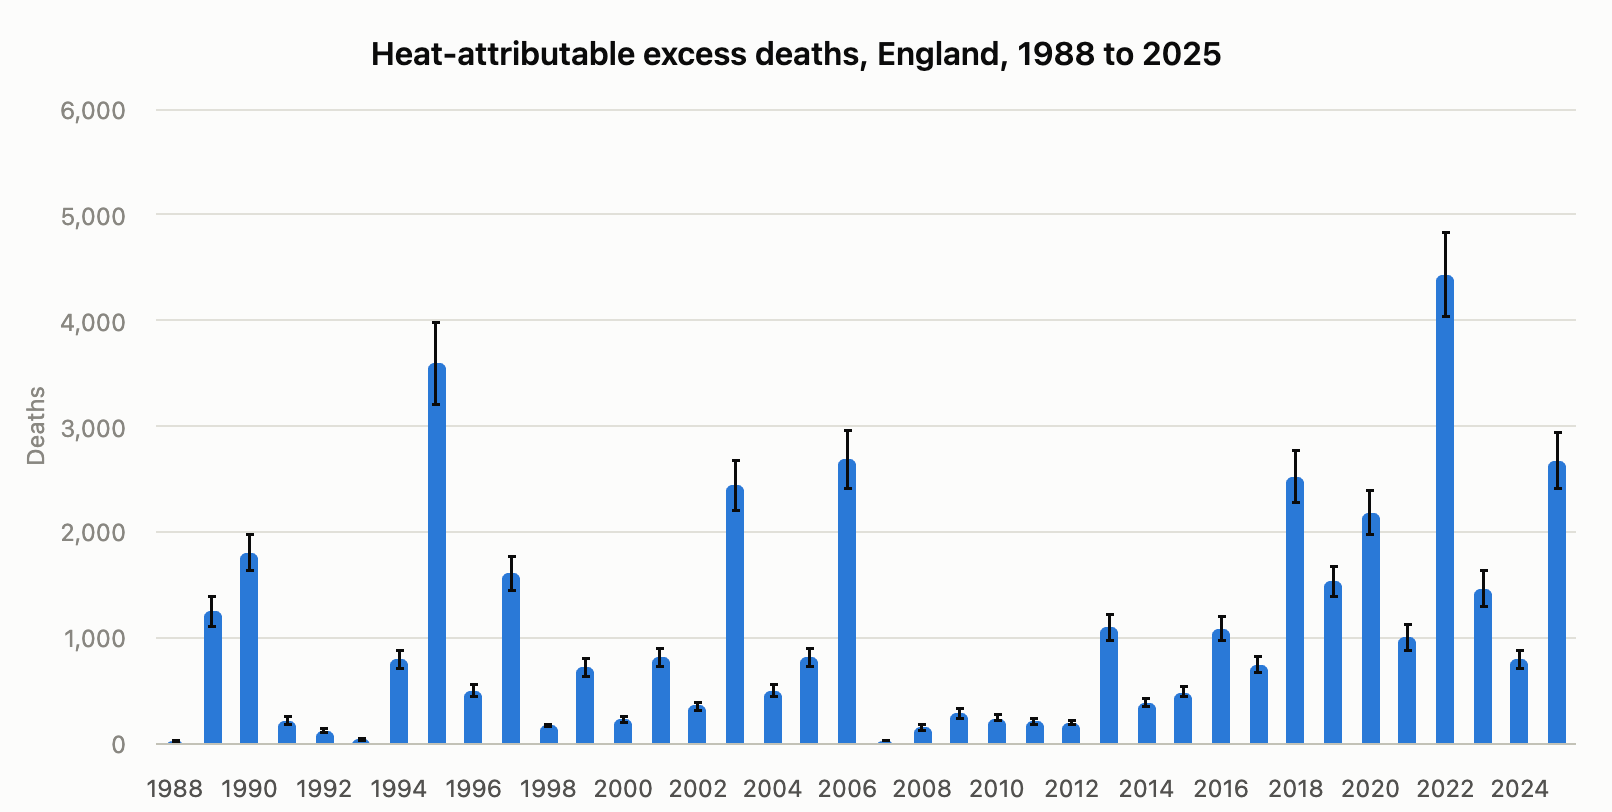
Since 1988 the number of people in the UK over 80 years old has also increased from just under 2 million to 3.8 million, so you might expect higher peaks today.
UKHSA only started publishing data based on the current methodology in 2020, so you can’t really see a trend yet.
Statistics in development
It’s also worth noting that the ONS statistics on climate-related mortality are “statistics in development”, previously called experimental statistics.
We advise caution when using the data and to consider the uncertainty around the estimates in the associated data table.
My understanding is that the UKHSA heat mortality data is not experimental, while the cold mortality data is considered statistics in development.
How many years of life are lost due to heat-related deaths?
UKHSA reports 5,109 years of life lost (YLL) for those aged 75 to 84, and about 2,978 for those ages 85 and over.
However, YLL uses standard life expectancy data for a given age. So if there are 793 excess deaths in those 85 and over, that shows that they used an average life expectancy for this cohort of 3.76 years.
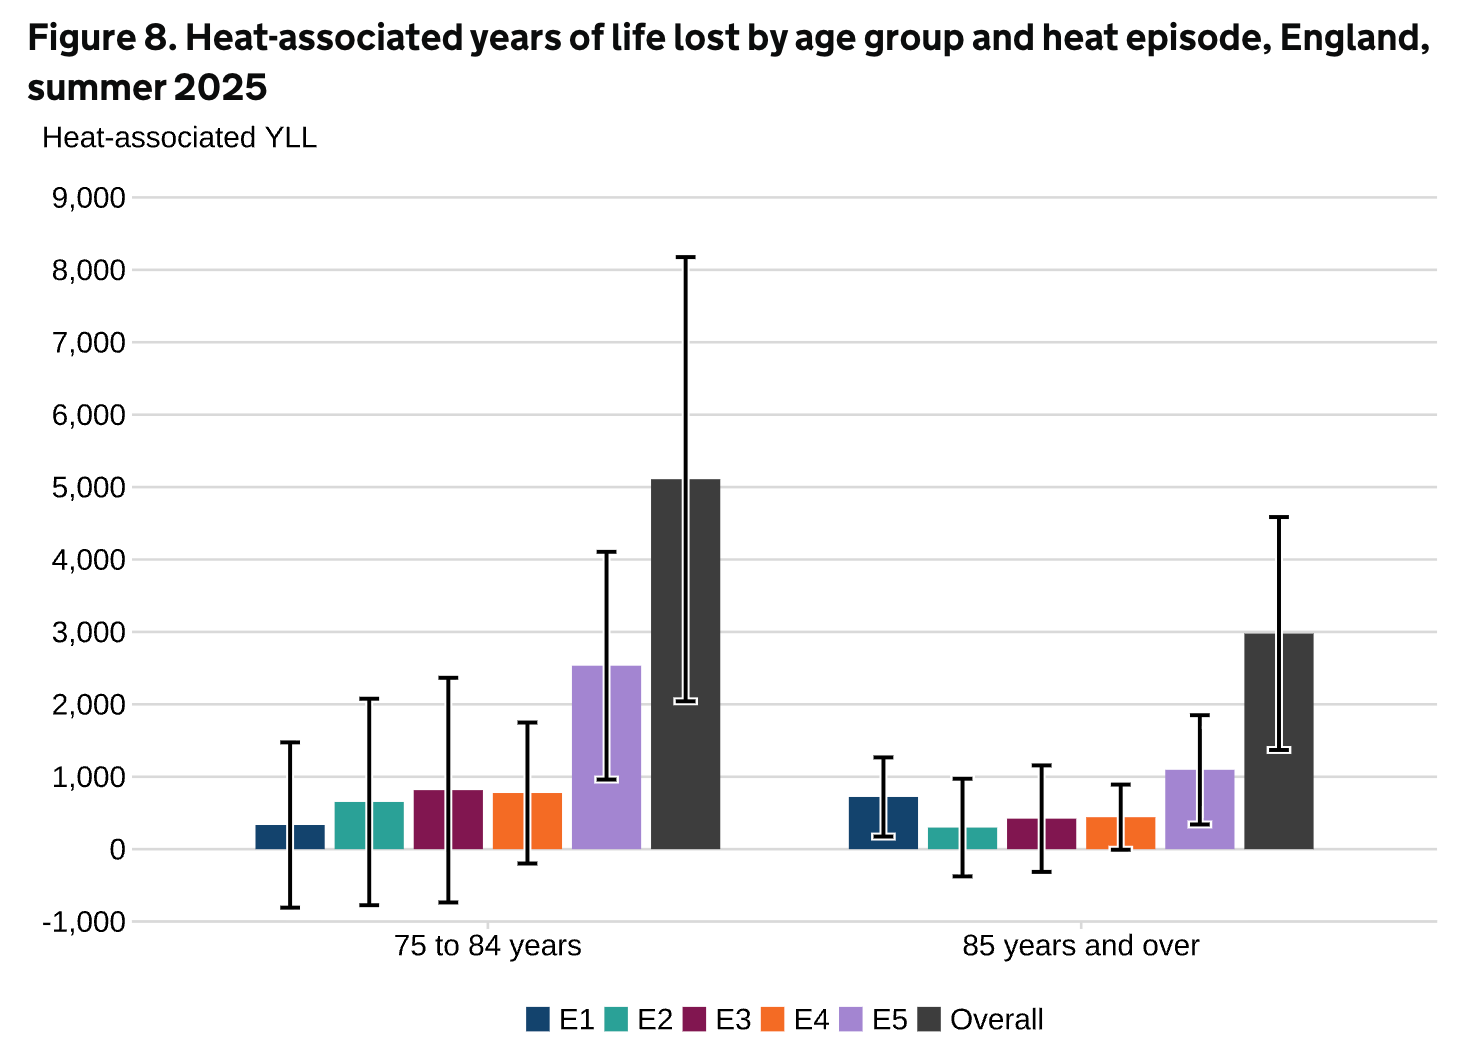
Importantly, this assumes that the people that die sooner from heat-related causes are average for their age group. However, if their life expectancy was adjusted for existing frailty, then the years of life lost would be lower.
For example, the ONS states the following about the 2022 data:
Each heat-period peak, most notably that on 19 July 2022, was followed by a fall in deaths to below the average over the following days; this suggests a short-term mortality displacement, where deaths among vulnerable individuals are ‘brought forward’ to within the heat-periods.
The 2023 Health Effects of Climate Change report also points out that some of the deaths may be related to short-term shifts.
Previous studies have estimated that between 10% and 70% of heat-associated mortality may be associated with short-term (up to a month) mortality displacement
The 45 to 64 age interval interesting because it shows roughly a hundred deaths with potentially long remaining lifespan. However, UKHSA does not calculate YLL “for younger age groups as they did not see statistically significant heat-associated mortality in summer 2025”.